Introduction
In modern cloud architectures, observability is critical. AWS CloudWatch is Amazon’s native observability and monitoring service that lets you collect metrics, logs, and events from your AWS resources, applications, and even on-premises systems. With CloudWatch, you gain visibility into system performance, can set alarms, visualize dashboards, and automate responses to changes.
In this post, we’ll cover:
-
How to use CloudWatch
-
Types and components
-
Possible combinations / use patterns
-
Advantages & disadvantages
-
Common real-world errors & troubleshooting (basic → advanced)
-
Additional tips & best practices
-
Conclusion summarizing key takeaways
We’ll also link to related content on cloudknowledge.in where relevant, to help with internal SEO and navigation.
How We May Use AWS CloudWatch
Here are some typical use cases / usage patterns:
-
Resource & Infrastructure Monitoring
Monitor CPU, memory, disk I/O, network, and other metrics for EC2, RDS, EKS, Lambda etc. (EC2 by default sends metrics every 5 minutes; you can enable detailed monitoring to get 1-minute granularity) -
Application / Custom Metrics
You can push custom application metrics (e.g. request latency, business metrics) via the AWS CLI / API usingPutMetricData. -
Centralized Log Monitoring & Analysis
Use CloudWatch Logs to ingest, store, search, and analyze logs from EC2 instances, Lambda, CloudTrail, Route53, etc. Use Logs Insights to query across logs. -
Alarms & Automated Responses
Define thresholds (e.g. CPU > 80% for 5 min) and trigger notifications (via SNS) or auto-remediate (via Lambda or autoscaling). -
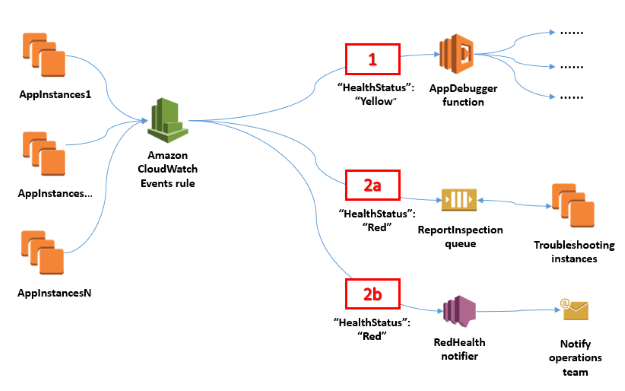
Event Monitoring / EventBridge Integration
Use CloudWatch Events (or EventBridge) to detect state changes (e.g. EC2 state transitions, API calls, scheduled events) and route to targets (Lambda, SNS, SQS). -
Dashboards & Visualization
Create custom dashboards combining multiple metrics/logs to monitor service health at a glance. -
SLO / Observability Patterns
Use CloudWatch Application Signals (if available) or integrate SLO-based alerting and burn rate monitoring. AWS is increasingly focusing on integrating CloudWatch with observability tooling.
In short: CloudWatch lets you detect, investigate, and respond to operational incidents in real time.
You might want to link to a more basic primer on AWS / monitoring on cloudknowledge.in (for example, your article: “What Is AWS?” or “Introduction to Cloud Monitoring”) — e.g.:
For a foundational overview of AWS services, see our article “What Is AWS?” on cloudknowledge.in.
Types / Components of CloudWatch
Here are the main building blocks (types / modules) in CloudWatch:
Combination / Usage Patterns
You rarely use only one component in isolation. Common combinations / patterns include:
-
Metrics + Alarms: Basic pattern to alert on resource thresholds (CPU, memory).
-
Logs + Metric Filters + Alarms: Use log content to derive metrics (e.g. error count) and trigger alerts.
-
Events + Lambda / SNS: Detect changes (e.g. new resource launched) and trigger automation or notifications.
-
Dashboards combining Metrics + Logs Insights queries: For unified observability.
-
Auto Scaling or Remediation Actions: Alarms trigger auto-scale or Lambda remediation.
-
SLO / Burn Rate monitoring: Combine multiple metrics/logs to compute SLA adherence and alert on violation.
-
Cross-account / cross-region aggregation: Use CloudWatch cross-account dashboards or log aggregation patterns.
-
Retention / archival strategy: Use long-term storage (e.g. S3) for logs, and shorter retention for hot metrics/logs.
By combining these building blocks, you can craft robust observability pipelin
Advantages & Disadvantages
Advantages
Native integration with AWS
CloudWatch works out-of-box with most AWS services (70+).Scalable & managed
AWS handles the scaling, durability, and availability of metric / log storage.
Flexible
You can ingest custom metrics, logs, events, define alarms, automate responses.Real-time / near real-time insights
You can get metrics in short periods and detect anomalies early.Visualization & dashboards
Built-in dashboards make it easy to build views across your infrastructure.Cost control
Helps you detect resource waste, underutilization, or unexpected surges (optimize spend).Observability enhancements
With new features like Application Signals, better correlation between logs/metrics/traces.Disadvantages / Challenges
Cost
Many metrics, log ingestion, query scanning can add up in large environments.Missing features / limitations
Log Insights queries can be expensive for huge data; certain log retention / archiving patterns need external S3 / Glue.Complexity at scale
In large multi-account, multi-region setups, managing dashboards, alarms, cross-account aggregation becomes non-trivial.Learning curve
One must learn metrics, dimensions, logs, query language, alarm semantics.Latency / SLA limits
Some metrics are delayed; high-resolution metrics are costlier.Cost of incorrect alarms / noise
Too many false positives / alerts can desensitize operations teams.
It’s good to weigh these trade-offs when designing your CloudWatch strategy.
Additional Details & Best Practices
-
Retention & Archival Strategy
Use short retention for detailed logs, archive older logs to cheaper storage (e.g. S3 + Glacier). -
Use metric math / derived metrics
Combine multiple metrics via math (e.g. rate, sums, differences). -
Use anomaly detection
CloudWatch supports anomaly detection models for metrics (auto-thresholding). -
Use efficient queries / pagination
When querying logs with Insights, limit the scan scope, use indexed fields, and control time windows. -
Use Contributor Insights
For analyzing top “contributors” (e.g. top slowest endpoints). -
Tagging & naming conventions
Standardize namespaces, metric names, and dimensions to ease dashboards & automation. -
Alert fatigue management
Group alarms, use composite alarms, set min periods, silence windows. -
Cross-account dashboards / central logging account
Use a central account to aggregate metrics/logs. -
Security & access control
Use IAM roles / policies to restrict access to logs, metrics, and query permissions.
You could link internally to cloudknowledge.in articles like “Best Practices for AWS Logging” or “Designing Monitoring Dashboards in AWS”.
Common Errors & Troubleshooting Steps
Below are some frequent errors / issues that users encounter with CloudWatch, along with troubleshooting guidance from basic to advanced.
No metrics showing / missing data
Possible causes & checks:
Detailed monitoring is not enabled (by default EC2 metrics come every 5 minutes). → Enable detailed monitoring.
The metric you expect is in a different namespace / dimension than assumed.
Permissions / IAM issues: The role or user lacks
cloudwatch:GetMetricDataorcloudwatch:ListMetricspermissions.Time range / period misconfiguration in console.
Metric suppressed because of missing data – the alarm may not treat missing data points. Use the missing data treatment option (e.g. “breaching”, “notBreaching”, “ignore”). Tutorials Dojo
Troubleshooting steps:
Verify if the resource is emitting metrics (e.g. check EC2 monitoring tab).
Use AWS CLI:
aws cloudwatch list-metrics --namespace AWS/EC2 --metric-name CPUUtilizationAdjust time window / period in console or CLI.
Check IAM permissions on the role/user.
If no data at all, check if the CloudWatch agent (if used) is running properly on your host.
Turn on debug / verbose logging of agent to see errors.
Alarms not triggering (even though metric crossed threshold)
Possible causes:
Alarm is misconfigured with wrong metric, namespace, or dimension.
The evaluation period / data points to alarm criteria is not met.
Missing data treated as non-breaching by default.
The metric has high resolution / nonalignment in period boundaries.
Notification target (SNS) misconfigured or disabled.
The alarm is in
INSUFFICIENT_DATAstate due to lack of data.
Troubleshooting steps:
Review alarm configuration: metric, namespace, dimensions, period, threshold, watch period (number of data points).
Check whether the metric truly exceeded threshold for the right consecutive periods.
Change “missing data” setting (treat missing as breaching).
Verify SNS topic subscription (check if subscriber endpoint is confirmed).
In CloudWatch console, look at the History tab of the alarm to see transitions.
Use CloudWatch metrics graph to overlay threshold and check metric behavior.
If alarm remains in
INSUFFICIENT_DATA, ensure you have recent datapoints.
Slow or high latency in Logs Insights queries / “Query timed out”
Possible causes:
Very large log groups / span time window causing scanning of massive data.
Lack of indexed fields, forcing full scan.
Complex query expressions or too many operations.
Insufficient resource limits or throttling.
Troubleshooting steps:
Narrow the time window to a smaller interval (e.g. last 1h or 30m).
Use filters early (e.g.
filter @message like /ERROR/) before aggregation.Use indexed fields in log groups to speed queries.
Break complex query into smaller subtasks.
Use pagination / batch results.
For very heavy workloads, export logs to OpenSearch or Athena for deeper analysis.
(AWS blog has use case: deliver CloudWatch logs to OpenSearch Serverless) Amazon Web Services, Inc.
Incorrect aggregation / count_distinct anomalies in Insights
Symptom: You run a count_distinct in CloudWatch Logs Insights and get approximate or unexpected results (e.g. missing records).
Explanation & cause:
count_distinctis approximative when the cardinality of distinct values is large.The underlying engine uses probabilistic algorithms which can introduce slight errors.
If your logs are unevenly partitioned, some values may not be seen in the scan.
Troubleshooting / mitigation:
If the cardinality is high, break the query by partition or smaller groups.
Combine with other filters to reduce dataset size.
Use alternate approaches: aggregate via external tools (Athena, OpenSearch) for exact counts.
Cross-check result with sample few logs to validate correctness.
Note: There is a user discussion about this on StackOverflow:
“You can count unique field values using the
count_distinctinstruction inside CloudWatch Insights queries.”
Conclusion
AWS CloudWatch is a powerful, native observability platform for AWS environments. It enables you to monitor resources (metrics), ingest and search logs, trigger alarms, visualize dashboards, and build automated operational responses.
While CloudWatch offers deep integration, scalability, and flexibility, using it effectively at scale requires careful design — managing costs, reducing alert noise, optimizing log queries, and ensuring cross-account / multi-region observability.
By combining metrics, logs, alarms, events, dashboards, and newer observability features like Application Signals, you can build an operational monitoring system that helps you detect issues early, respond fast, and maintain reliability.
Finally, in any real-world setup, you will face errors — missing metrics, silent alarms, slow queries, aggregation inaccuracies. Use the troubleshooting steps above (from basic to advanced) as a guideline when things don’t behave as expected.
If you like, I can tailor this further for your cloudknowledge.in site (add internal links, banner suggestions, FAQs, images), or I can convert into HTML / ready-to-publish post. Do you want me to format it ready for your site or generate meta tags / schema markup version?




Leave a Reply